

Published TCIMAIL newest issue No.199
Maximum quantity allowed is 999
Please select the quantity

Table of contents
Detection of Glycolipids by TLC-Immunostaining
TLC immunostaining for glycolipids is a technique where glycolipids are separated by thin layer chromatography (TLC) and detected using specific antibodies. Samples containing glycolipids are applied to a TLC plate, separated based on their molecular mobility, treated with antibodies specific to the separated glycolipids, and stained with enzyme-labeled secondary antibodies to identify the target glycolipids. The key advantages of TLC immunostaining include minimal sample pretreatment and the ability to simultaneously separate and detect multiple glycolipids, thus making it suitable even for small sample volumes. This method is faster and simpler compared to other techniques for analyzing complex glycolipids.
Reagents and Materials
- Glycolipid Solution: Dissolved at 0.1 mg/mL in methanol
- TLC Development Solvent: Chloroform/methanol/water (60:35:8) (Chloroform (Product No. C1111), Methanol (Product No. M0628)
- TLC Plate Coating Agent: 0.4% isobutyl methacrylate (polymer) in hexane (Isobutyl methacrylate (polymer) (Product No. M0086), Hexane (Product No. H0490))
- Blocking Solution: 1% BSA (bovine serum albumin) in PBS
- Plate Washing Solution: PBS (phosphate-buffered saline)
- HRP Substrate Solution: TMB (3,3',5,5'-Tetramethylbenzidine) solution (Product No. T3854), etc.
- Primary Antibody: Anti-SSEA-4 (SialylGb5) Monoclonal Antibody (Product No. A3742)
- Secondary Antibody: Goat Anti-Mouse IgG+M HRP Conjugate
Procedure
- Glycolipid Spotting: Spot 1 μL of each glycolipid (0.1 mg/mL in methanol) 5 times onto the TLC plate.
- Plate Development: Use Development Solvent to develop the spotted glycolipids.
- Coating: Immerse the TLC plate in Plate Coating Agent for 1 minute.
- Drying: Let the plate dry.
- Blocking: Immerse the plate in Blocking Solution for 30 minutes at room temperature.
- Washing: Wash the plate with PBS and let the plate dry.
- Primary Antibody: Apply Primary Antibody solution (10 μg/mL) to the plate, and incubate for 1 hour at room temperature.
- Washing: Wash the plate with PBS and let the plate the plate dry.
- Secondary Antibody: Apply Secondary Antibody solution (1 μg/mL) to the plate, and incubate for 30 minutes at room temperature.
- Washing: Wash the plate with PBS and let dry.
- Color development: Apply HRP Substrate Solution (TMB) to visualize spots.
Experimental Example
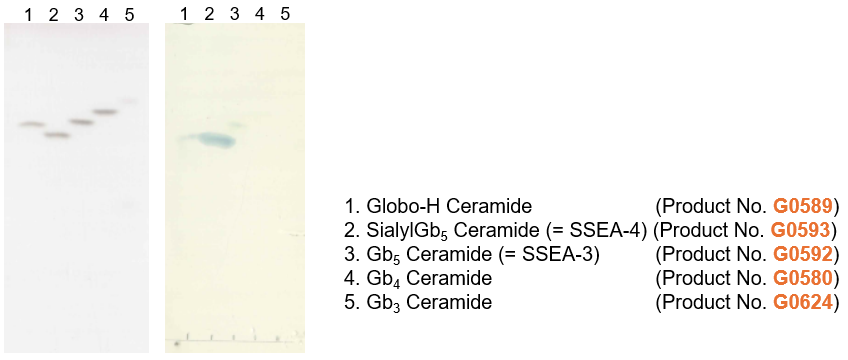
Figure. Detection of SSEA-4 ceramide by TCI-immunostaining method
(Left: Glycolipids detected using 10% ethanol sulfate; Right: SSEA4 ceramide detected using Anti-SSEA-4 (SialylGb5) Monoclonal Antibody.)
Related Products
Detection of Cell Surface Glycolipids by FCM
Flow cytometry (FCM) for detecting cell surface involves the use of specific antibodies or lectins to bind glycolipids, with fluorescence intensity measured on a cell-by-cell basis. This technique provides highly sensitive analysis of glycolipid expression on the cell surface. Other glycolipid detection methods include thin- layer chromatography (TLC), and mass spectrometry (MS). FCM can analyze thousands of cells per second, providing a unique advantage by enabling the comparison of glycolipid expression patterns in individual cells, thus offering a perspective different from MS. While MS excels in compositional analysis and structural identification, FCM is particularly useful for pathological analysis and biomarker discovery based on cell-specific glycolipid diversity.
Reagents and Materials
- Preserved Miniature Pig Blood
- Red Blood Cell Lysis Buffer
- Cell Washing Solution: PBS containing 1% FBS
- Anti-αGal Polyclonal Antibody R-PE Conjugate (Product No. A3354)
- Anti-NeuGc Polyclonal Antibody R-PE Conjugate (Product No. A3360)
- Chicken IgY PE Conjugate (Isotype control)
Procedure
- Hemolyse Preserved Miniature Pig Blood to isolate peripheral blood mononuclear cells (PBMCs).
- Wash 3 times with PBS containing 1% FBS.
- Add Anti-αGal Polyclonal Antibody R-PE Conjugate or Anti-NeuGc Polyclonal Antibody R-PE Conjugate, along with isotype control to a final concentration of 10 μg/mL each and incubate on ice for 30 minutes.
- Wash 3 times with PBS containing 1% FBS.
- Measure peripheral blood mononuclear cells using flow cytometry.
Experimental Example
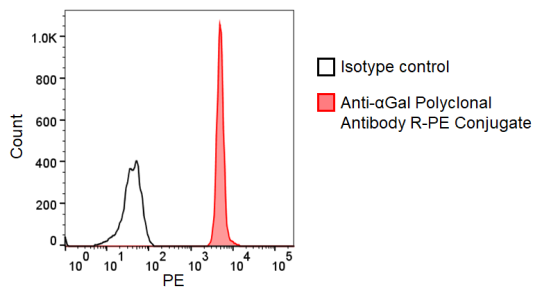
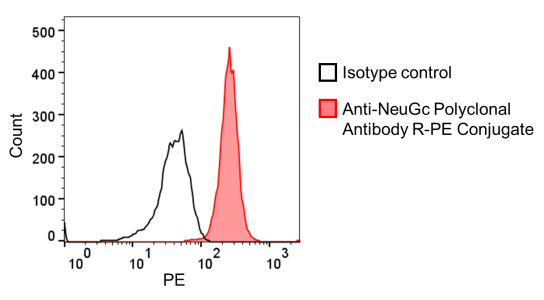
Figure. Flow cytometry detection of NeuGc in miniature pig granulocytes
References
- Delayed anaphylaxis, angioedema, or urticaria after consumption of red meat in patients with IgE antibodies specific for galactose-α-1,3-galactose
- At least two Fc Neu5Gc residues of monoclonal antibodies are required for binding to anti-Neu5Gc antibody

Related Products
Specific Detection of Chondroitin Sulfate-A (CS-A) and Chondroitin Sulfate-D (CS-D) Using Anti-Chondroitin Sulfate Antibodies
The extracellular matrix (ECM) is an essential component in higher organisms, facilitating the formation of cells, tissues, and organs, as well as regulating cell-cell junctions and functions. The ECM also significantly influences various biological processes, including development, aging, inflammation, wound healing, and immunity. Glycosaminoglycans (GAGs), such as chondroitin sulfate, hyaluronic acid, and keratan sulfate, are major components of the ECM and play vital roles in these processes. However, analyzing GAGs, particularly in situ within cells and tissues, is challenging. As a result, antibodies are valuable tools for their detection.
Reagents and Materials
- BSA-conjugated Chondroitin Sulfate Antibodies (CS-A: derived from whale cartilage, CS-D: derived from shark cartilage, CS-E: derived from squid cartilage)
- Anti-Chondroitin Sulfate A Monoclonal Antibody (LY111) (Product No. A3143) (0.1 μg/mL dilution)
- Anti-Chondroitin Sulfate D Monoclonal Antibody (MO-225) (Product No. A2872) (0.05 μg/mL dilution)
- HRP-conjugated Goat Anti-Mouse IgG+M Antibody (1:10000 dilution)
- Coating Buffer: 0.1 M Carbonate Buffer pH 8.5
- Wash Buffer: TBST (Tris-buffered saline with 0.05% Tween 20 (Product No. T2530))
- Blocking Buffer: 1% BSA/TBST
- HRP Chromogenic Substrate Solution (TMB solution (Product No. T3854), etc.
- Stop Solution: 1 N HCl
- ELISA plate (high-binding)
Procedure
- Coating: Add 100 μL of each BSA-conjugated CS (diluted to 1 μg/mL in coating buffer) to separate wells of a high-binding ELISA plate and incubate overnight at 4 °C.
- Blocking: After washing (*), add 150 μL/well of blocking buffer to wells and incubate at room temperature for 2 hours.
- Primary Antibody: After washing (*), add 100 μL of anti-CS antibodies (diluted with blocking buffer) to the appropriate wells and incubate at room temperature for 30 minutes.
- Secondary Antibody: After washing (*), add 100 μL/well of HRP-conjugated Anti-Mouse IgG+M Antibody (diluted with blocking buffer) and incubate at room temperature for 30 minutes.
- Chromogenic Reaction: After washing (*), add 100 μL/ well of HRP Chromogenic Substrate Solution and incubate at room temperature for 30 minutes.
- Measurement: Add 100 μL/well of Stop Solution and measure the absorbance at 450 nm (Ref. 630 nm) with a plate reader.
*Between each step, wash plates 3 times (twice after coating) with 200 μL/well of wash buffer.
Experimental Example
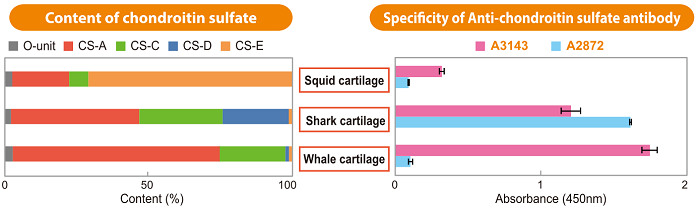
Figure. Specific Detection of Chondroitin Sulfate-A (CS-A) and Chondroitin Sulfate-D (CS-D) Using Anti-Chondroitin Sulfate Antibodies
References
Anti-Chondroitin Sulfate D Monoclonal Antibody (MO-225)
- A Monoclonal Antibody That Specifically Recognizes a Glucuronic Acid 2-Sulfate-containing Determinant in Intact Chondroitin Sulfate Chain
- Distribution of chondroitin sulphate proteoglycans and peanut agglutinin-binding molecules during bovine fetal palatine ridge formation
- Structural characterization of the epitopes of the monoclonal antibodies 473HD, CS-56,and MO-225 specific for chondroitin sulfate D-type using the oligosaccharide library
Anti-Chondroitin Sulfate A Monoclonal Antibody (LY111)
- Occurrence of collagen and proteoglycan forms of type IX collagen in chick embryo cartilage. Production and characterization of a collagen form-specific antibody
- Structural determination of novel sulfated octasaccharides isolated from chondroitin sulfate of shark cartilage and their application for characterizing monoclonal antibody epitopes
- Construction of a chondroitin sulfate library with defined structures and analysis of molecular interactions
Related Products
Detection of Antibody Glycans (Detection of Non-Human Glycans of Therapeutic Antibodies)
The glycan structure of antibody and biopharmaceutical drugs has a significant impact on drug efficacy and safety. Glycans are involved in antibody stability, blood half-life, and immunoreactivity. In particular, glycosylation of the Fc region affects antibody-dependent cellular cytotoxicity (ADCC) and complement-dependent cytotoxicity (CDC). Since non-human animal cell lines are also used in the production of biopharmaceuticals, the addition of non-human glycans, especially those containing α-1,3-galactose and N-glycolylneuraminic acid (Neu5Gc), is undeniable. These glycans can be recognized by the human immune system and may increase the risk of immune or allergic reactions. For these reasons, the detection of non-human-type glycans has become important. The detection applications of these non-human glycans are presented here.
Reagents and Materials
- Anti-Human Fc Antibody
- Anti-αGal Chicken Polyclonal Antibody HRP Conjugate (Product No. A3195)
- Coating buffer: 0.1 M carbonate buffer (pH 8.5)
- HRP chromogenic substrate solution (TMB solution (Product No. T3854)), etc.
- Wash buffer: TBST (Tris-buffered saline with 0.05% Tween 20 (Product No. T2530))
- Blocking solution: 1% BSA/TBST
- High binding type ELISA plate
Procedure
- Coating of antibody: Coat the high conjugate ELISA plate with 5 μg/mL, 100 μL of anti-human Fc antibody for 2 hours at room temperature or overnight at 4°C. Then incubate the plate for 2 hours at room temperature or overnight at 4°C.
- Blocking: Add 150 μL of blocking solution to each well and block overnight at room temperature for 2 hours or overnight at 4°C.
- After washing the wells, dilute the test sample (cetuximab) to each concentration (0-100 ng) in the blocking solution, apply to the wells, and react for 1 hour at room temperature.
- After washing the wells, add 100 μL of detection antibody (Anti-αGal Chicken Polyclonal Antibody HRP Conjugate) diluted 2000-fold to each well and react for 1 hour at room temperature.
- After washing the wells, add 100 μL of HRP chromogenic substrate solution and allow to react for 30 minutes.
- Add 100 μL of reaction stop solution and measure with a plate reader at 450 nm (Ref. 630 nm).
- Wash the plate three times with 200 μL of washing buffer, discarding the reaction solution from the well.
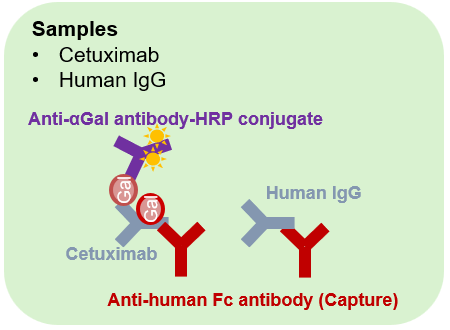
Schematic diagram of the sandwich ELISA assay
Experimental Example
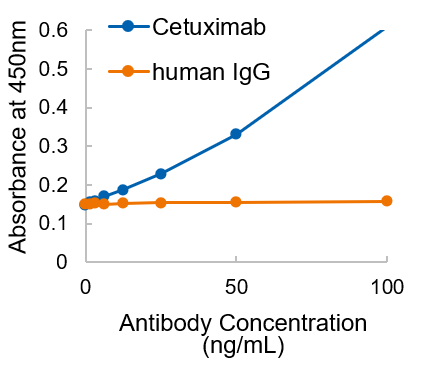
Figure. Detection of non-human glycans (αGal) present in the therapeutic antibody in a dose-dependent manner in the range of 10-100 ng/mL by using sandwich ELISA
Detection of αGal / Neu5Gc Glycans in Therapeutic Antibodies by Immunoblotting
Reagents and Materials
- Anti-NeuGc Polyclonal Antibody HRP Conjugate (Product No. A3397)
- Anti-αGal Chicken Polyclonal Antibody HRP Conjugate (Product No. A3195)
- SDS-PAGE sample buffer (Product No. B5834, Product No. B6104, etc)
- HRP chromogenic substrate solution (TMB solution (Product No. T3854), etc.
- Wash buffer: TBST (Tris-buffered saline with 0.05% Tween 20 (Product No. T2530))
- Blocking solution: 1% BSA/TBST
- PDFV membrane
- Blotting apparatus (semi-dry type)
Procedure
- Sample preparation: Treat samples with SDS-PAGE sample buffer (reducing) and heat.
- Electrophoresis (SDS-PAGE): Load protein samples onto a polyacrylamide gel and separate by electrophoresis.
- Transfer (blotting): After electrophoresis, proteins are transferred from the gel to a membrane (PVDF membrane).
- Blocking: Block the membrane with blocking buffer (1% BSA/TBST) at room temperature for 2 hours.
- Primary Antibody: Incubate the blocked membrane with primary antibody at room temperature for 1 hour.
- Membrane washing: Wash the membrane 3 times with washing buffer (TBST) to remove nonspecific antibodies.
- Detection: Detect using HRP enzyme substrate.
Experimental Example
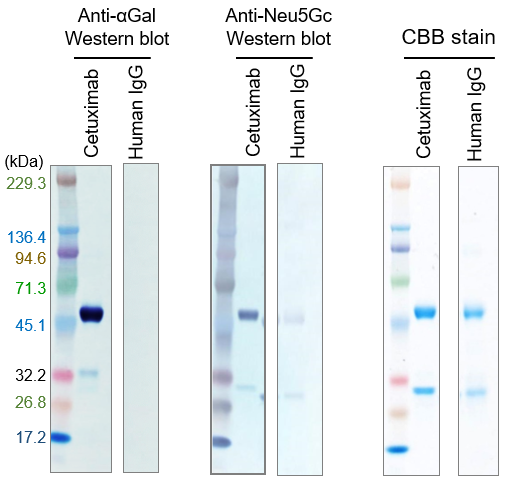
Figure. Detection of αGal / Neu5Gc glycans in therapeutic antibodies by immunoblotting
Other Examples: Detection of αGal Epitope of Therapeutic Antibodies Cetuximab by Immunochromatography Using Anti-αGal Polyclonal Antibody
Immunochromatography is a simple and rapid method that requires only a drop of specimen and provides results within 15 minutes. If both the test and control lines are chromogenic, the result is positive; if only the control line is chromogenic, the result is negative.
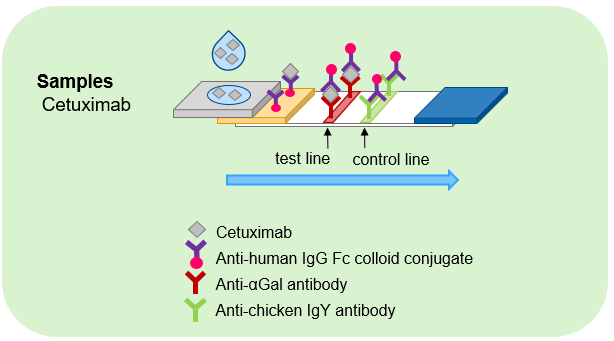
Schematic diagram of the immunochromatography assay
Experimental Example
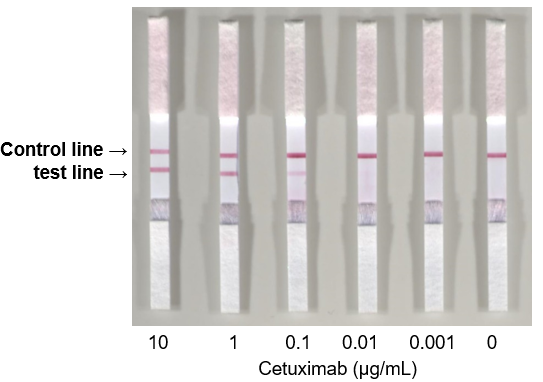
Figure. Easy and quick detection of the αGal epitope present in the therapeutic antibody by using the immunochromatography method
This research is partially supported by the developing key technologies for discovering and manufacturing pharmaceuticals used for next-generation treatments and diagnoses both from the Ministry of Economy, Trade and Industry, Japan (METI) and from Japan Agency for Medical Research and Development (AMED). This research was supported by AMED under Grant Number JP20ae0101057.